


Centric Pricing & Inventory
Increase Profitability with AI-Powered Predictive Pricing and Inventory
Maximize margins by optimizing pricing to influence demand.
Accelerate growth by aligning customer demand with accurate supply.
Sell more with less inventory and reduce discounting.


Designed for the world’s top fashion, apparel and home brands and retailers
including omnichannel, wholesaler and e-commerce.
Make concrete impact with fast time to value for fashion, apparel and footwear brands and retailers
6-18%
growth in sales
4-15%
improved gross margin
5-30%
reduced working capital
50%
decrease in personnel costs
Optimize Pricing and Inventory for Maximized Revenue
Accelerate In-Season Decision Making with Centric.
With margin pressure on every single SKU, brands and retailers can no longer make pricing and inventory decisions based on the past.
Trying to manually find and maintain optimal pricing, promotion and inventory throughout a product’s lifecycle for 1000s of products is time consuming and error prone. Further complicated by the growing number of influencing factors that need to be considered, it’s impossible to manage on spreadsheets and without the use of AI automation tools.
Even rule-based pricing doesn’t go far enough, with pricing and inventory decisions based on historical, backward oriented data, which consistently leads to sub-optimal outcomes.
Powerful AI enables forward-facing forecasts, intelligent pricing and inventory recommendations and the automation of tasks to optimize every product, in every location and channel to increase sell through, reduce inventory and maximize profits.

"Thanks to Centric’s AI automation tools, the markdowns happen sooner and in smaller increments. This results in a flatter reduction curve and in the end, a better margin in terms of the entire lifecycle of the product."
![]()
Explore Centric’s AI-driven Pricing and
Inventory Optimization Solution
Move towards predictability, automation and adaptability to drive smarter decision making to ensure prices, promotions, product placement and inventory levels align with customer demand. Minimize missed sales revenue, stockouts and overstock, and increase customer satisfaction.

Facilitate in-season optimization
Set initial allocation and pricing based on the Merchandise Financial Plan and adjust plans in-season depend on market reaction, competitors' strategies and a number of external factors. Capitalize on products in high demand with price increases and create demand through pricing changes for slower moving items.

Improve sell-through and increase sales
Optimize pricing across various stages of the retail lifecycle. Create and influence demand for slow moving products through pricing strategies and fulfil that demand with powerful allocation and replenishment tools. Reduce inventory and increase sell through to drive sales.

Drive sustainability with effective inventory management
Predict future demand and replenishment needs for products so teams can price, allocate, replenish and reorder more profitably for an unlimited number of SKUs. Reduce overstock to align with sustainability goals.

Focus on automation for smarter decision making
Work smart and enable AI to predict future demand for any product in any location and then automate the work of pricing and replenishing every single product. Multiply human effort by combining both artificial and human intelligence.
Create, influence and fulfill demand.
Move away from product shortages and surpluses to balanced inventory levels, higher sell-through and increased margin.
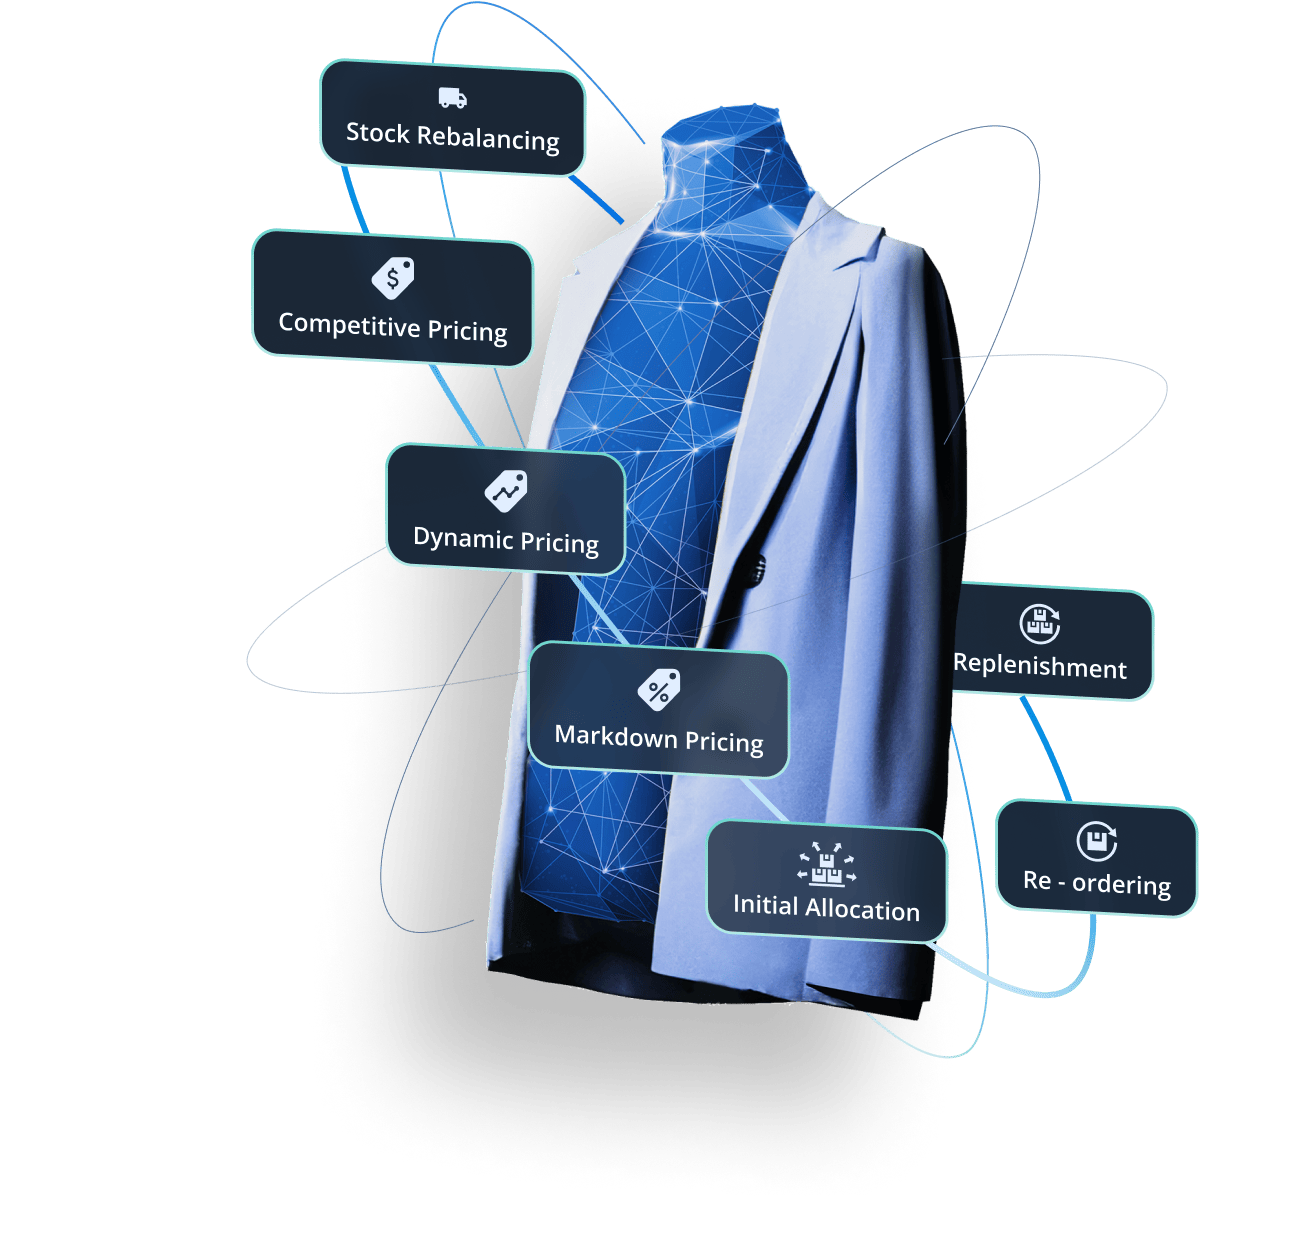
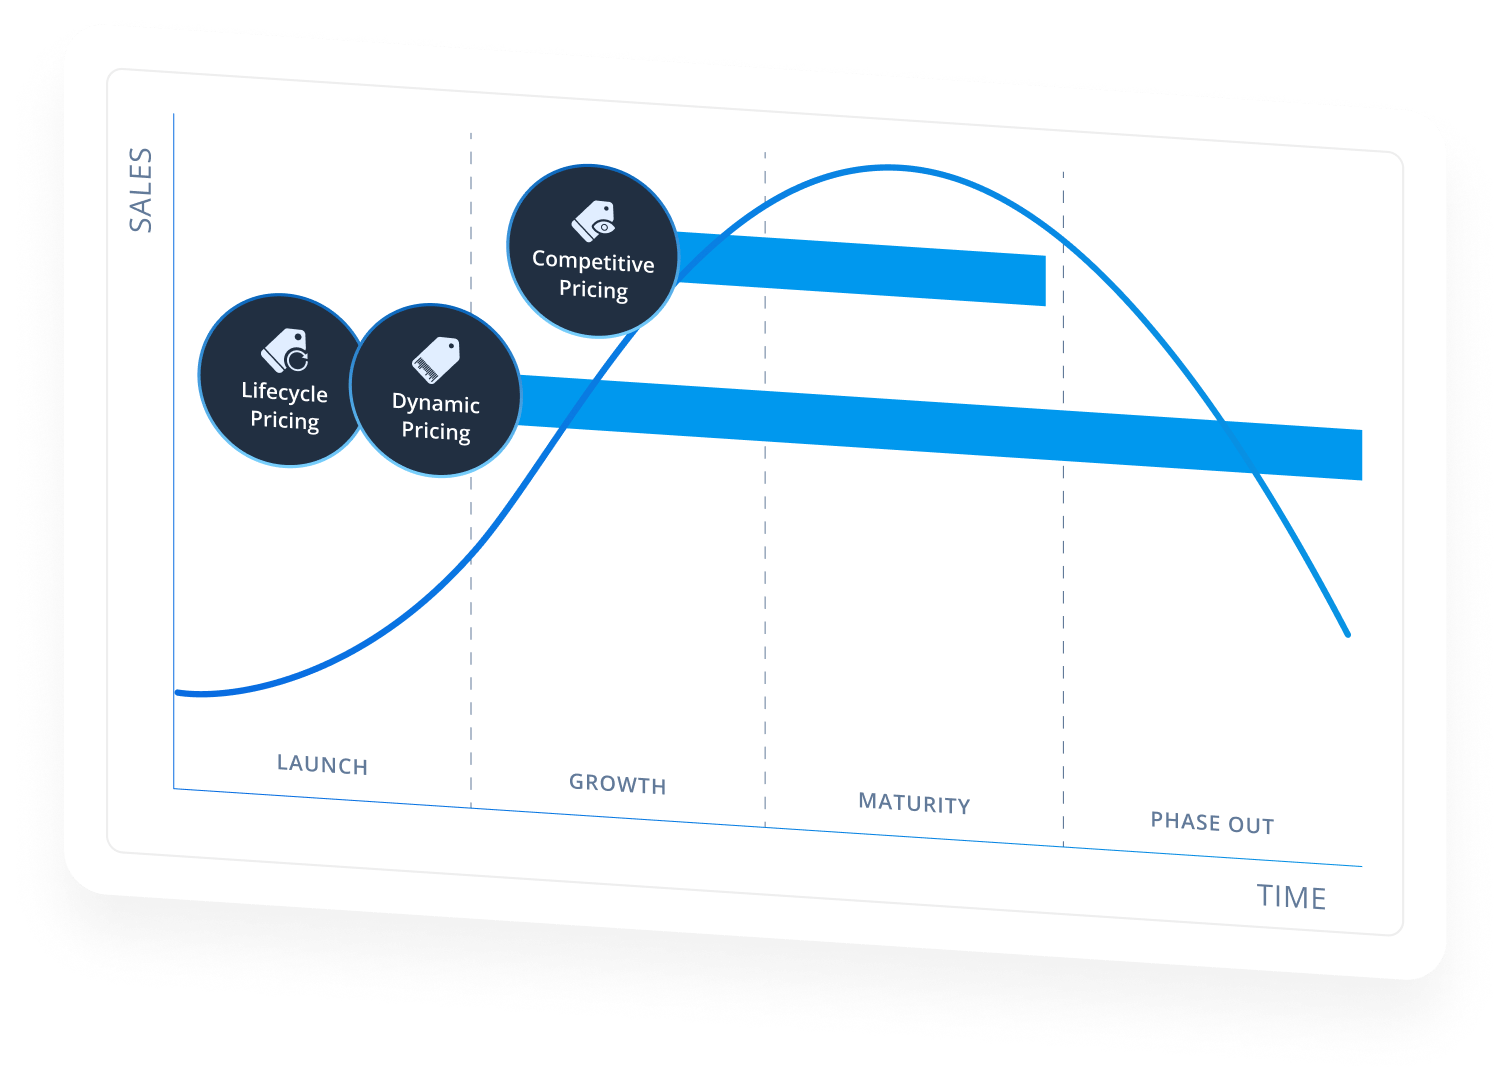
Price Optimization
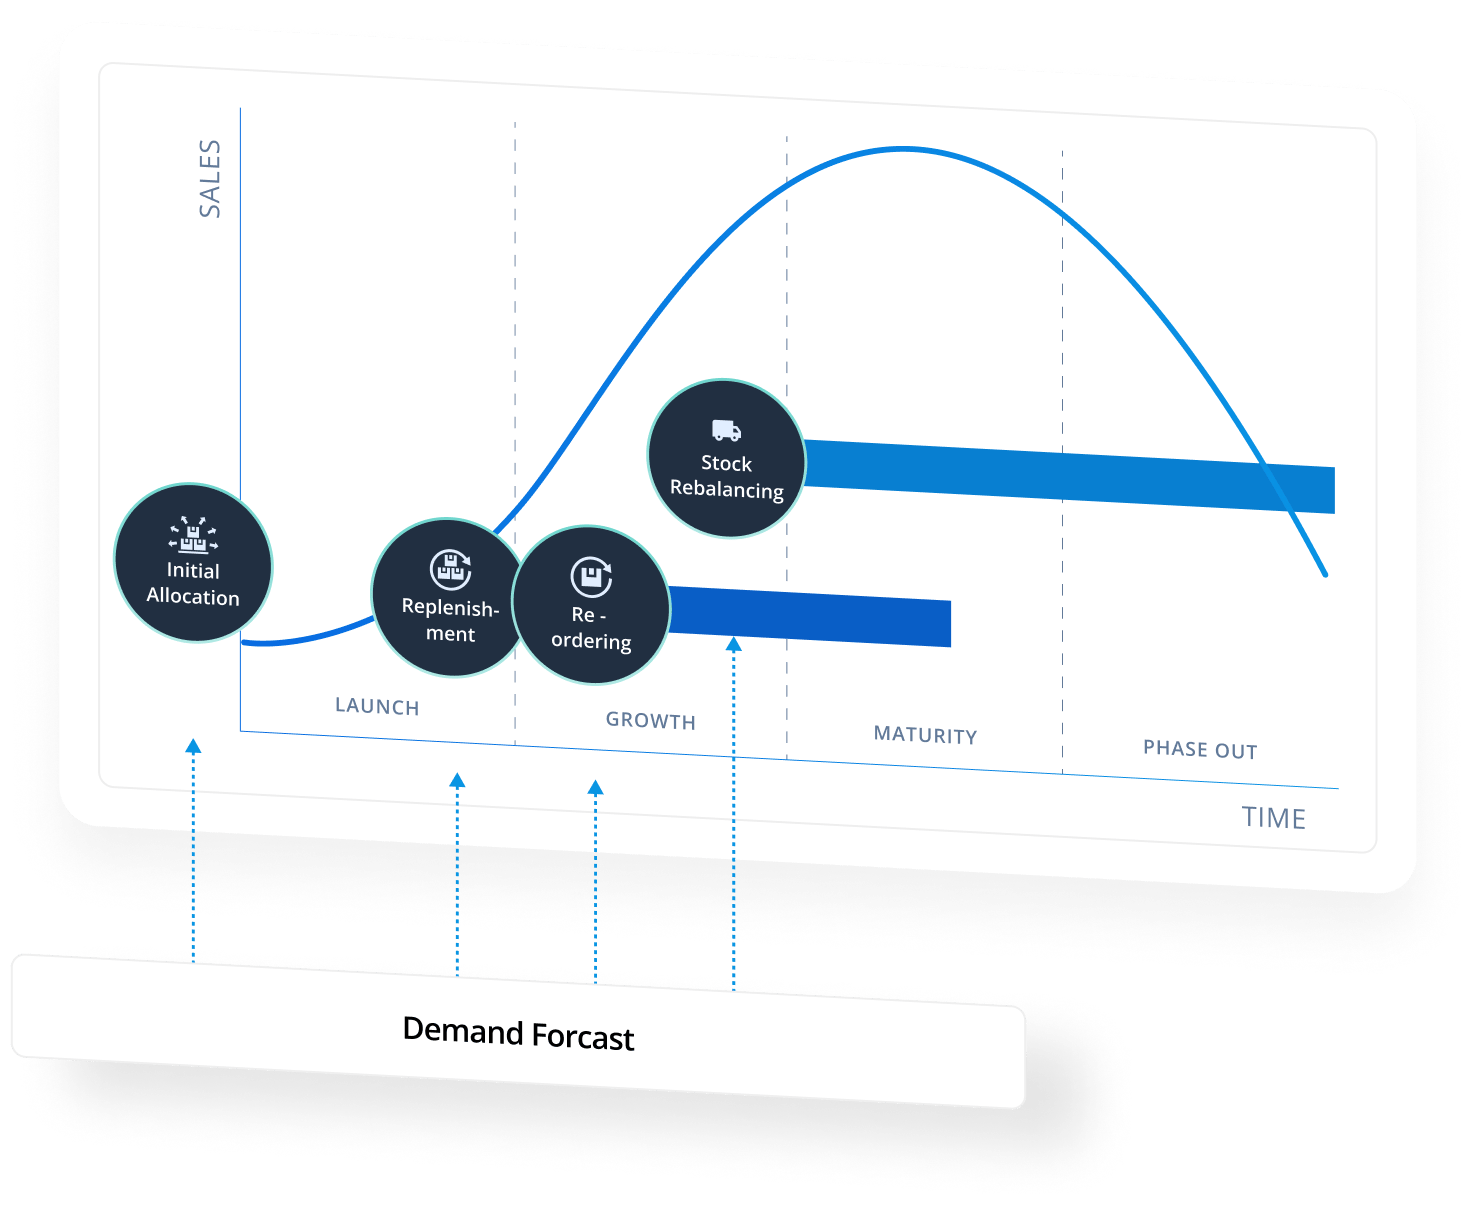
Inventory Optimization
 Lifecycle Pricing:
Develop the optimal price for seasonal products from launch, all the way through to markdowns.
Dynamic Pricing:
Quickly adjust e-commerce pricing for infinite stock items based on market reactions.
Competitive Pricing:
Compare pricing against competitors for key items and automate price changes in response to competitor strategies.
Initial Allocation:
Automate, based on demand forecast, the initial supply of new and seasonal articles across stores, channels and locations.
Replenishment:
Enable demand-driven replenishment to ensure a continuous supply of articles to prevent stockouts while avoiding over purchase of inventory.
Stock Rebalancing:
Balance stock across the entire business, find profitable transfer options and identify the best locations to sell to reduce the need for discounting.
Navigate the future with cutting-edge AI technology
Invest in highly configurable dashboards with ‘white box’ AI which allows users to see, compare and over-ride any predicted outcomes. Or accept recommendation based on a confidence threshold to automate decisions so teams can focus on the exceptions. Manage more complexity with less effort while achieving strong financial results.

Transparency
See the impact that every pricing or inventory decision has on overall company goals and gain trust with decisions and suggestions that are comprehensible.

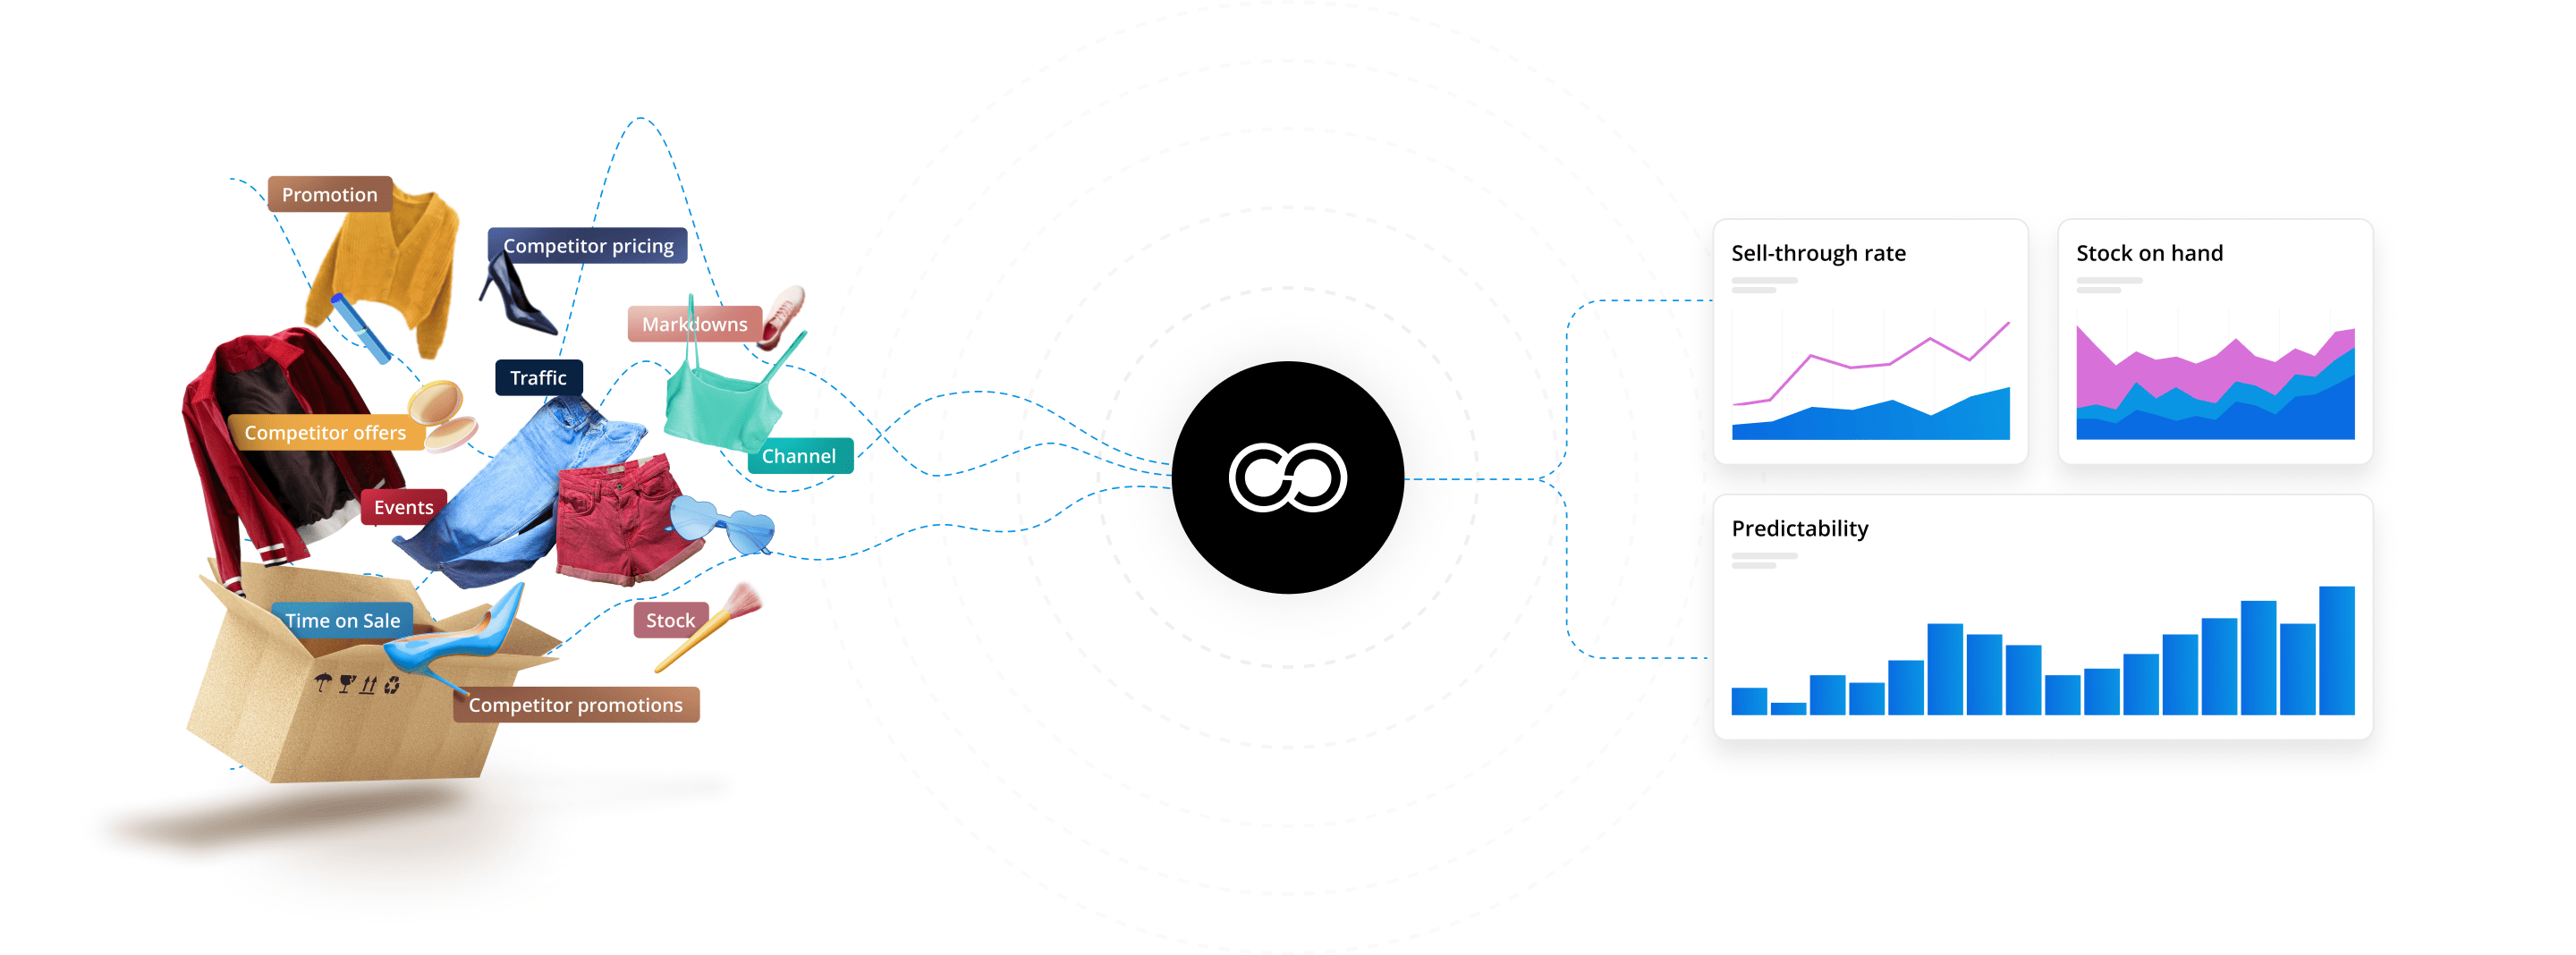
Predictability
Use your own company data to predict future demand per article, location and sales channel taking into account a business’ specific strategies and constraints.

Automation
Human-led automation gives the power to the user to choose when to accept or override the system’s suggested pricing and inventory changes.

Adaptability
AI systems learn and adapt over time as they compile information to make decisions. Enable teams to keep up with changing market conditions and customer preferences.
Discover how teams increase profitability with our Pricing & Inventory platform.
Request a demoWant to learn more about Centric Pricing & Inventory?


A flexible and scalable digital foundation for growth
Explore Centric’s AI market-driven solutions
Optimize each step of bringing a product to market, whether at the pre-season, in-season or end-of-season cycle. Streamline processes, reduce costs, maximize profitability and drive sustainability.
Centric PLM
Reduce costs and time to market. Improve collaboration to get products to market fast while improving sustainability with market-leading product lifecycle management.
Learn moreCentric Planning
Build and execute your Merchandise Financial Plan and develop assortments to boost margins, improve forecasting and optimize results with powerful, AI-driven retail planning.
Learn moreCentric Pricing & Inventory
Automate pricing decisions for all products across categories and channels and optimize allocation and replenishment to increase margins, revenue and sell-through.
Learn moreCentric Market Intelligence
Gain insights into competitor assortment and pricing strategies, understand consumer trends and buying behavior and spot market opportunities.
Learn moreCentric Visual Boards
A visual-first approach to bridge gaps between teams and systems. Accelerate and transform decision making with a visual pivot table.
Learn more